The 2020 Financial Stress survey was commissioned by Manulife Investment Management and
John Hancock Retirement — conducted by Greenwald & Associates.
John Hancock Retirement — conducted by Greenwald & Associates.
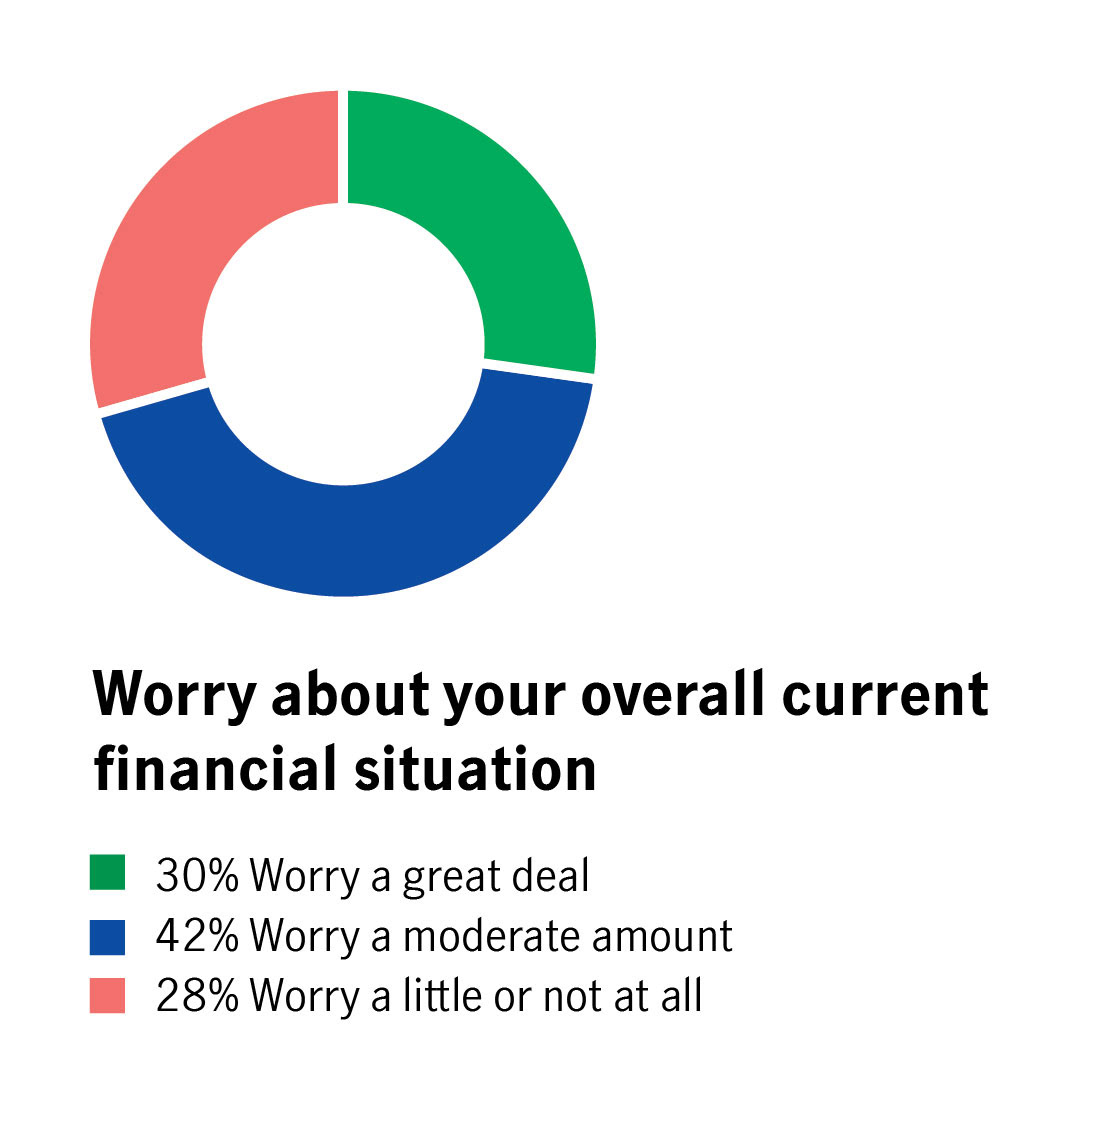
Accessible charts and graphs
Step 1 — simplify
The first step in making an accessible graphic is to simplify the information. The research findings were presented in complex slides not suited for an accessible document. I edited so there was only one finding per graphic.
The first step in making an accessible graphic is to simplify the information. The research findings were presented in complex slides not suited for an accessible document. I edited so there was only one finding per graphic.
Step 2 — write for everyone
If it makes sense when you read it out loud, it’ll make sense to someone using a screen reader. Rewriting captions and legends for assistive devices helps every reader.
If it makes sense when you read it out loud, it’ll make sense to someone using a screen reader. Rewriting captions and legends for assistive devices helps every reader.
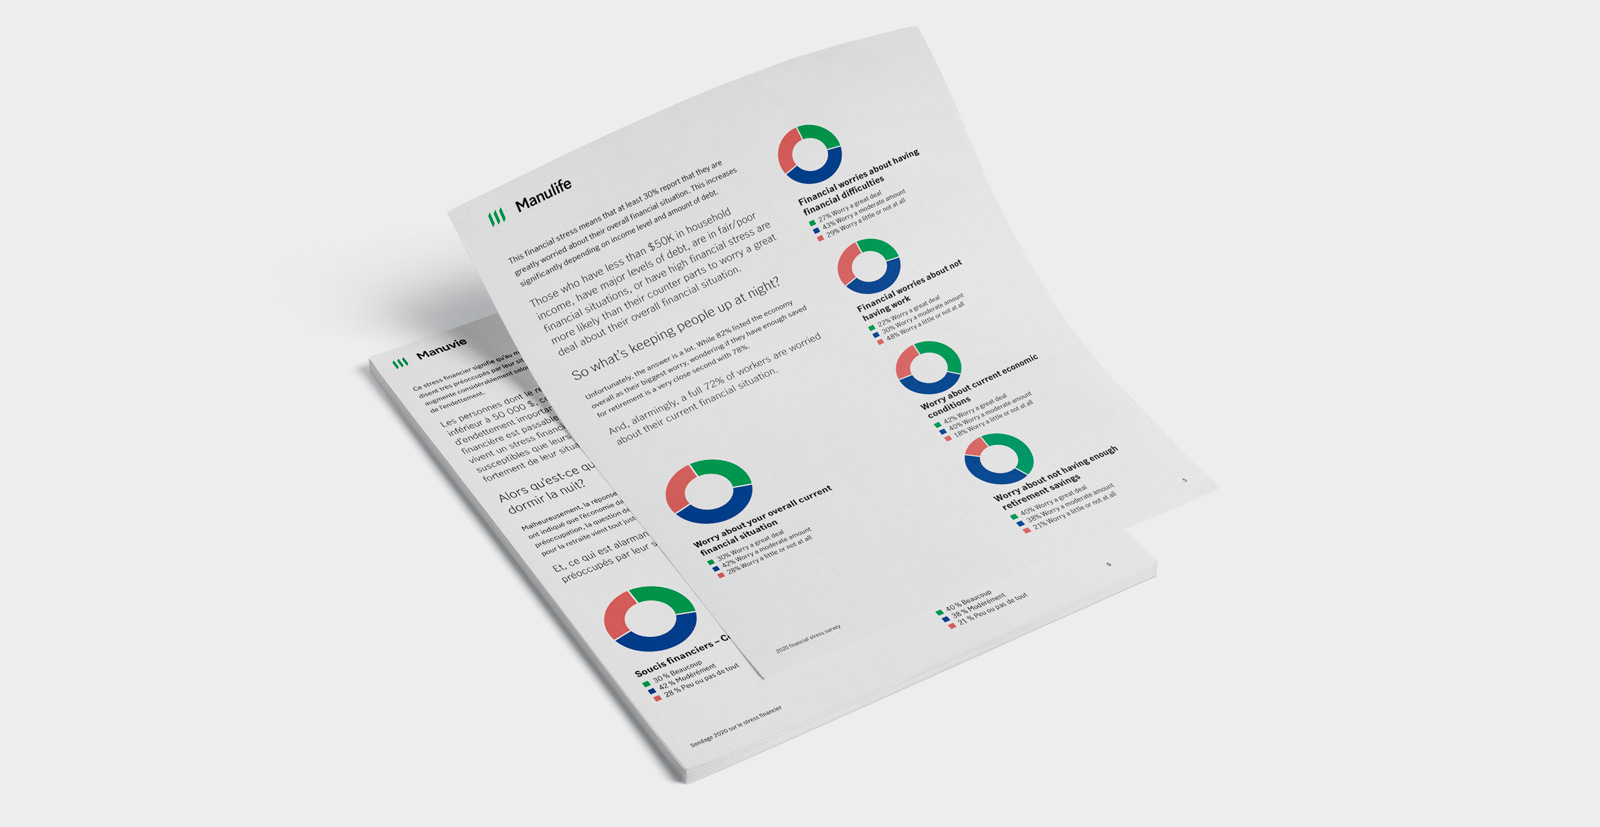
Step 3 – artifacts
Readers who have no vision won’t get any information from the graphics. Tag them as artifacts so that assistive devices will skip them.
Readers who have no vision won’t get any information from the graphics. Tag them as artifacts so that assistive devices will skip them.